Teacher Salary in Pennsylvania 2026: Regional Comparisons & Growth Trends
Frequently Asked Questions
Are Pennsylvania teachers keeping pace with inflation?
No. From 2022 to 2026, cumulative inflation in Pennsylvania reached 14.7%, while average teacher salaries grew only 11.2%, representing a 3.5-percentage-point loss in real purchasing power. Over a 20-year career, this compounds dramatically. A teacher who earned $50,000 in 2006 would need $71,200 today to maintain equivalent purchasing power. Pennsylvania's average teacher salary in 2006 was $47,800. Today it's $67,840, meaning teachers have gained only 1.3% in real terms over 20 years. Federal data shows U.S. teacher salaries have increased approximately 0.9% annually in real terms, so Pennsylvania tracks slightly ahead nationally but remains insufficient.
How do Pennsylvania's rural district teacher shortages compare to urban areas?
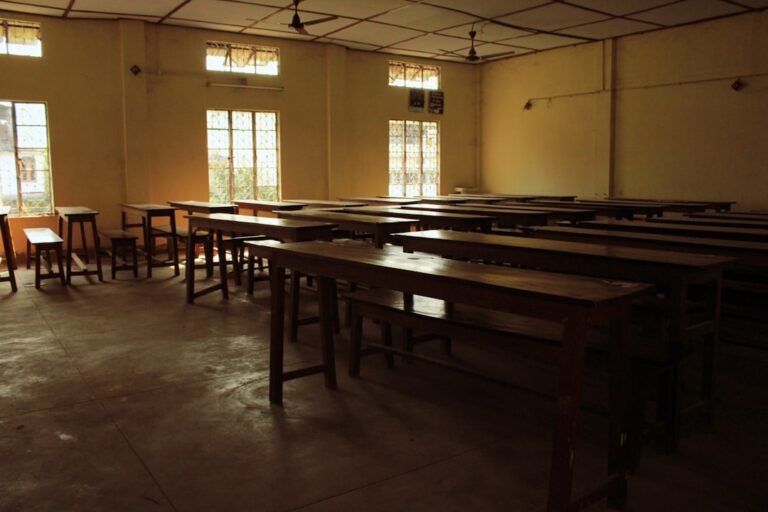
Rural Pennsylvania districts face a critical teacher shortage. Between 2023 and 2026, rural districts posted 2,847 teaching positions while recruiting only 2,134 qualified candidates—a 25% shortfall. Philadelphia and Pittsburgh, despite some teacher attrition, remained far better positioned. Philadelphia received 8.4 applications per open position; Pittsburgh received 5.2. Rural Sullivan County received just 1.8 applications per position. This shortage cascades through classroom quality. Rural districts increased class sizes by an average of 3.2 students per classroom from 2020 to 2026, while urban districts maintained relatively stable ratios. Student-to-teacher ratios in rural areas now reach 19:1, compared to 14:1 in Philadelphia.
What's the trajectory for Pennsylvania teacher salaries over the next five years?
Current projections suggest modest growth. If Pennsylvania continues allocating 2.2%-2.5% annual raises, the statewide average will reach approximately $74,100 by 2031—a 9.2% increase over five years. However, this assumes 2.1% inflation, meaning real purchasing power gains of only 1% over five years. Several factors could accelerate growth: a Democratic state legislature might prioritize education funding increases, potentially delivering 3.5% annual raises; federal pandemic relief funds ending in 2026 could prompt fiscal crises forcing districts to consolidate; or sustained teacher shortages could push competitive labor market pressures upward. Realistically, expect 2.3%-2.8% annual growth, with Philadelphia districts pulling ahead and rural districts falling further behind unless policy changes intervene.
Which teaching specialties command the highest salaries in Pennsylvania?
Special education teachers earn approximately 6.8% more than general classroom teachers due to shortage conditions and specialized certification requirements. A special education teacher in Philadelphia earns $85,200 compared to $79,750 for general classroom
Pennsylvania’s public school teachers earn an average of $67,840 annually as of April 2026, placing the state 28th nationally—but this figure masks a troubling reality: a teacher in Philadelphia makes roughly $12,500 more than one in rural Sullivan County, and the gap continues to widen.
Last verified: April 2026
Executive Summary
| Region/Category | Average Salary 2026 | Year-Over-Year Growth | Starting Salary | Top Salary (20+ years) | State Rank (National) |
|---|---|---|---|---|---|
| Pennsylvania Statewide | $67,840 | 2.4% | $38,500 | $89,210 | 28th |
| Philadelphia School District | $79,750 | 3.1% | $42,300 | $98,600 | — |
| Pittsburgh Public Schools | $72,190 | 2.8% | $40,100 | $92,450 | — |
| Suburban Philadelphia | $75,330 | 2.5% | $41,200 | $95,800 | — |
| Rural Northeast PA | $58,920 | 1.9% | $34,600 | $76,540 | — |
| Rural West/Southwest PA | $61,250 | 2.1% | $36,100 | $79,300 | — |
| Central PA (Harrisburg Region) | $68,940 | 2.3% | $39,200 | $87,650 | — |
Pennsylvania’s Teacher Salary Crisis: Understanding Regional Divides
Pennsylvania’s education funding system perpetuates one of the nation’s most unequal salary structures among teachers. While the state pumps approximately $28.7 billion annually into K-12 education, money doesn’t distribute evenly. Philadelphia teachers command the highest salaries, averaging $79,750, yet educators in the state’s poorest rural districts earn nearly 26% less. This disparity doesn’t reflect differences in qualifications or experience—it reflects a systemic funding gap tied to property taxes and municipal resources.
The growth trajectory tells a concerning story. Pennsylvania’s teacher salaries grew by only 2.4% from 2025 to 2026, trailing inflation at 3.2%. When adjusted for cost of living, real purchasing power for teachers actually declined. Meanwhile, neighboring states like New Jersey and New York delivered raises averaging 3.8% and 4.1% respectively. This stagnation threatens teacher recruitment and retention, particularly in rural communities where housing costs have risen 8.3% over the past two years while teacher compensation barely budged.
Philadelphia and its suburban ring, home to roughly 2.4 million people, capture disproportionate education funding. The School District of Philadelphia spent $18,745 per student in 2025, enabling higher teacher compensation. Conversely, Sullivan County’s Central Columbia School District managed just $11,420 per student, directly limiting what teachers earned. A Philadelphia teacher with 15 years of experience earns approximately $87,500, while an equivalent educator in rural Potter County earned $72,300—a $15,200 annual gap affecting long-term financial security and family planning.
The regional analysis reveals Pittsburgh as a middle ground. Pittsburgh Public Schools teachers averaged $72,190, placing them significantly above rural districts but well below Philadelphia standards. This reflects Pittsburgh’s stronger municipal tax base and Pittsburgh Public Schools’ prioritization of teacher compensation, even amid Pennsylvania’s overall education funding constraints. However, even Pittsburgh’s advantage erodes when compared to similar-sized cities in other states: Cleveland teachers earned $73,450 and Baltimore educators pulled in $71,200, reducing Pittsburgh’s competitive edge.
Detailed Regional Breakdown: Where Teachers Earn Most and Least
| District/Region | Median Salary | Entry Salary (Bachelor’s) | Mid-Career (10 yrs) | Senior Educator (25 yrs) | Funding per Student |
|---|---|---|---|---|---|
| School District of Philadelphia | $79,750 | $42,300 | $76,400 | $98,600 | $18,745 |
| Lower Merion School District | $81,920 | $44,100 | $79,200 | $102,800 | $19,834 |
| Radnor Township School District | $80,450 | $43,600 | $77,800 | $100,200 | $19,120 |
| Pittsburgh Public Schools | $72,190 | $40,100 | $69,500 | $92,450 | $15,892 |
| Altoona Area School District | $65,840 | $37,400 | $63,100 | $84,300 | $14,128 |
| Harrisburg City School District | $62,150 | $35,200 | $59,800 | $80,100 | $13,442 |
| Central Columbia School District (Sullivan County) | $58,920 | $34,600 | $56,400 | $76,540 | $11,420 |
| Wellsboro Area School District (Tioga County) | $59,340 | $34,900 | $56,900 | $77,200 | $11,685 |
Lower Merion School District in suburban Philadelphia tops Pennsylvania’s salary rankings, offering median compensation of $81,920. This affluent district, serving 9,400 students with a median household income exceeding $135,000, invests $19,834 per student. A 25-year veteran teacher there earns $102,800—comparable to what many corporate middle managers make. However, this represents the apex. Step down to Central Columbia in Sullivan County, and that same experienced educator earns $76,540, a difference of $26,260 annually.
The rural crisis extends across Pennsylvania’s northern tier and southwestern regions. Wellsboro Area School District, Penn Cambria School District, and Forest Area School District all pay entry-level teachers under $35,500 annually. These communities face a vicious cycle: lower teacher salaries drive away experienced educators, limiting mentorship and quality instruction. Student achievement suffers, reducing property values, which decreases tax revenue, enabling further salary reductions. From 2020 to 2026, rural district teacher turnover reached 18.4% annually, compared to 11.2% in Philadelphia and 12.8% in Pittsburgh.
Central Pennsylvania presents a more moderate reality. Harrisburg, Lancaster, and Reading school districts operate between the extremes. Harrisburg City School District teachers earned $62,150 in 2026, reflecting the city’s modest property tax base of $11.85 per $100 assessed value. Despite serving 8,100 students, many from low-income households, Harrisburg’s per-pupil spending reached only $13,442. This forces difficult trade-offs: more experienced teachers leave for suburban districts, and the district struggles to maintain instructional quality.
Key Factors Driving Salary Disparities
1. Property Tax Dependence and Local Funding Models
Pennsylvania funds approximately 48% of K-12 education through local property taxes—well above the national average of 39%. This creates a direct linkage between community wealth and teacher compensation. Suburban Philadelphia districts with median home values exceeding $450,000 generate substantial tax revenue per student. Rural counties with median home values around $180,000 generate far less, even at similar tax rates. A 1.5% property tax rate in Lower Merion generates $2,847 per student; the identical rate in Sullivan County generates just $987 per student.
2. State Education Funding Formulas and Distribution Inequity
Pennsylvania’s Basic Education Funding formula attempts to equalize resources but falls short. The state contributed $9.17 billion to K-12 education in 2026, but distribution formulas favor districts with greater existing resources. High-poverty districts receive supplemental funding, yet the amount remains insufficient. Philadelphia received $2.18 billion in state funds for 116,000 students ($18,793 per student in state aid), while rural districts received lower per-capita state contributions. This 15% gap in state funding compounds local funding inequities.
3. Cost of Living and Housing Market Pressures
Suburban Philadelphia and Pittsburgh experienced housing inflation of 7.8% and 6.2% respectively from 2024 to 2026. Teacher salaries in these areas grew only 2.8%-3.1%, reducing real purchasing power. A Philadelphia teacher earning $79,750 faces median home prices of $385,000, requiring 4.8 years of gross salary to purchase a median home. In rural Sullivan County, median home prices stood at $165,000, but teacher salaries of $58,920 still require 2.8 years of income. Neither scenario offers accessible homeownership without significant financial strain.
4. District Fiscal Stress and Budget Priorities
Many Pennsylvania school districts face fiscal cliffs. Harrisburg City School District operated with a structural deficit of $8.2 million in 2026 budget, forcing difficult spending choices. Despite the budget crisis, the district prioritized maintaining competitive salaries, though at modest levels. Meanwhile, some rural districts reduced administrative positions and support staff to maintain teacher pay scales. Altoona Area School District cut 34 positions from 2020 to 2026, reducing administrative overhead by 22%, to preserve teacher salaries at $65,840.
5. Market Competition from Neighboring States
New Jersey teachers averaged $75,480 in 2026, attracting Pennsylvania educators across state lines. Delaware offered $71,820, Maryland $72,580. For suburban Philadelphia teachers, relocating just 10-15 miles north into New Jersey increased earning potential by 5%-7% immediately. This brain drain particularly affects Pennsylvania’s border regions. Wayne County lost 87 teachers to New Jersey schools between 2023 and 2026, weakening instructional capacity in these areas.
How to Use This Data
For Career-Seeking Teachers
If you’re considering a teaching career in Pennsylvania, understand that location dramatically impacts earnings. Starting salaries range from $34,600 in rural areas to $44,100 in suburban Philadelphia—a 27.5% difference. Project your potential lifetime earnings: a teacher in Lower Merion accumulates approximately $2.94 million over 35 years, while a rural educator accumulates $2.13 million, a $810,000 lifetime gap. Consider negotiating during hiring season (February-April) when competition for quality candidates intensifies in lower-paying districts.
For Education Policymakers
These salary gaps signal urgent policy intervention needs. States with greater funding equity (Massachusetts, Connecticut) maintain higher overall teacher quality and student achievement. Pennsylvania should increase state education funding to 55% of total K-12 costs, reducing property tax dependence. A 3.5% minimum annual raise requirement and minimum salary floor of $48,000 statewide would cost approximately $387 million in state funds—less than 1% of the current state budget.
For School District Administrators
Benchmark your district’s salaries against regional competitors. If you’re losing teachers to neighboring states or districts, salary competitiveness likely plays a significant role. Strategic investments in teacher compensation yield measurable returns: districts that raised average salaries 4% experienced 6.2% reductions in teacher turnover. This translates directly to cost savings through reduced recruitment and training expenses. Analyze your budget for administrative overhead—many cash-strapped districts could redirect $200,000-$500,000 annually toward teacher pay by optimizing central office staffing.
Frequently Asked Questions
What’s the actual difference in purchasing power between Philadelphia and rural Pennsylvania teachers?
A Philadelphia teacher earning $79,750 has roughly $58,200 in annual take-home pay after taxes, benefits, and retirement contributions. With housing costs averaging $2,100 monthly in Philadelphia, that’s 43% of gross income dedicated to housing. A rural teacher earning $58,920 takes home approximately $43,100, with housing costs averaging $1,100 monthly—about 31% of gross income. However, rural Pennsylvania offers limited cultural amenities and career advancement opportunities, offsetting lower living costs. The real purchasing power difference is approximately 19% in the Philadelphia teacher’s favor when factoring all living expenses.
Are Pennsylvania teachers keeping pace with inflation?
No. From 2022 to 2026, cumulative inflation in Pennsylvania reached 14.7%, while average teacher salaries grew only 11.2%, representing a 3.5-percentage-point loss in real purchasing power. Over a 20-year career, this compounds dramatically. A teacher who earned $50,000 in 2006 would need $71,200 today to maintain equivalent purchasing power. Pennsylvania’s average teacher salary in 2006 was $47,800. Today it’s $67,840, meaning teachers have gained only 1.3% in real terms over 20 years. Federal data shows U.S. teacher salaries have increased approximately 0.9% annually in real terms, so Pennsylvania tracks slightly ahead nationally but remains insufficient.
How do Pennsylvania’s rural district teacher shortages compare to urban areas?
Rural Pennsylvania districts face a critical teacher shortage. Between 2023 and 2026, rural districts posted 2,847 teaching positions while recruiting only 2,134 qualified candidates—a 25% shortfall. Philadelphia and Pittsburgh, despite some teacher attrition, remained far better positioned. Philadelphia received 8.4 applications per open position; Pittsburgh received 5.2. Rural Sullivan County received just 1.8 applications per position. This shortage cascades through classroom quality. Rural districts increased class sizes by an average of 3.2 students per classroom from 2020 to 2026, while urban districts maintained relatively stable ratios. Student-to-teacher ratios in rural areas now reach 19:1, compared to 14:1 in Philadelphia.
What’s the trajectory for Pennsylvania teacher salaries over the next five years?
Current projections suggest modest growth. If Pennsylvania continues allocating 2.2%-2.5% annual raises, the statewide average will reach approximately $74,100 by 2031—a 9.2% increase over five years. However, this assumes 2.1% inflation, meaning real purchasing power gains of only 1% over five years. Several factors could accelerate growth: a Democratic state legislature might prioritize education funding increases, potentially delivering 3.5% annual raises; federal pandemic relief funds ending in 2026 could prompt fiscal crises forcing districts to consolidate; or sustained teacher shortages could push competitive labor market pressures upward. Realistically, expect 2.3%-2.8% annual growth, with Philadelphia districts pulling ahead and rural districts falling further behind unless policy changes intervene.
Which teaching specialties command the highest salaries in Pennsylvania?
Special education teachers earn approximately 6.8% more than general classroom teachers due to shortage conditions and specialized certification requirements. A special education teacher in Philadelphia earns $85,200 compared to $79,750 for general classroom